Public health research / Brockton, MA
Health starts with your environment.
HAFCore studies how the places students live shape how they eat and move, then shares findings with the city.
Fourteen months in planning/Brockton, MA/Certified nonprofit, July 2026
01 / About
I started with my own body.
My name is Andrew Preval. I lost 90 pounds. The change was real, but the number on the scale was never the lesson.
For a long time I thought my weight was a willpower problem. If I just tried harder, ate less, and moved more, it would fix itself. That is the advice everyone gave me. It did not work, and I felt like the failure was mine.
When things finally changed, I looked back and saw the real reason. It was not willpower. It was my environment. The food near me, the places I spent my time, and the shape of my daily routine decided most of what I ate and how I moved before I made a single choice.
That bothered me. If the environment did that to me, it was doing it to other students too. So I spent fourteen months planning a study to look at that environment directly, instead of blaming the people living inside it. HAFCore grew out of that work.


02 / What HAFCore does
We study the conditions around students, then share what we find.
This is not a small fix or a single program. Student health is a web of problems that feed each other, and the data that explains it is hard to reach with a survey alone. We use better tools to find it.
An incorporated nonprofit.
HAFCore is set up as a nonprofit and is certified in July 2026.
Student health, not one problem at a time.
Obesity, depression, and anxiety are not separate fights. They share the same environment, so we study them together.
The part advice skips.
Most advice stops at personal choice. We study the conditions around the choice, where the real pattern lives.
How we find what advice misses
Wearables
Devices track movement, sleep, and heart rate in real life, not from memory.
Apps
Simple logging lets students record food and routine in the moment.
AI
Models read large, messy data and surface patterns a person would miss.
03 / Research
Two priorities: physical and mental health.
We do not treat this as one narrow report. We look at two sides of student health and the environment behind each one.
Priority one
Physical health
Obesity and the conditions that drive it.
Priority two
Mental health
Depression, anxiety, and the rise in suicide.
Priority one
Physical health
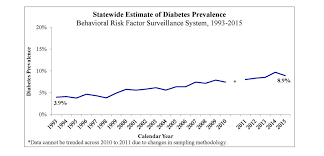
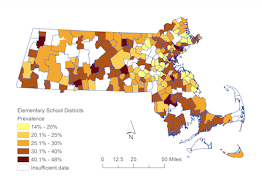
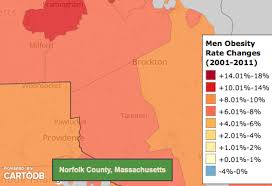
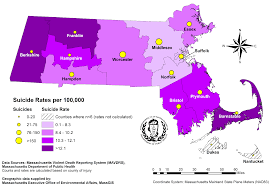
Obesity in Massachusetts has been climbing for years, and Brockton sits at the heavy end of it. Diabetes followed the same line, rising from about 2.5 percent in 1993 to 8.9 percent in 2015. These are not separate spikes. They move together.
The maps show it is not spread evenly. Some districts and some parts of the county carry far more of the weight than others. That gap is the clue. It points at the environment, not at effort, and that is the part we study.
Priority two
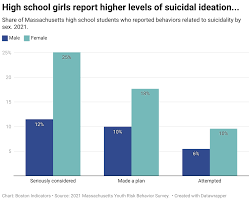
Mental health
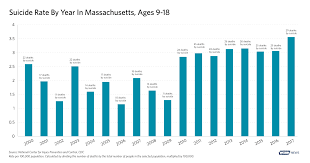
The suicide rate for young people in Massachusetts has been rising for years, and it is highest in the ages we study. Among high school students, the warning signs are not rare. Many have seriously considered suicide, made a plan, or attempted it, and the numbers are higher for girls.
Depression and anxiety do not appear out of nowhere. They grow in the same environment that shapes how students eat and move. We do not stop at the symptom. We trace it back to the root causes around the student.
How the study runs
- 01
Students log
Students log their movement and their food day to day.
- 02
Data goes to researchers
The logged data is sent to researchers for review.
- 03
An IRB certifies
An Institutional Review Board certifies the study.
- 04
Report to the city
HAFCore reports the findings back to the city.